Analytics
Strategy & Data-driven insights
When data is available, utilize it; when it's not, seek it out. Every product with a history of users and tools possesses data to offer (if you know where to search and how to analyze). Both quantitative and qualitative information is vital for successful products and teams. Any organization can effectively gather and utilize data to enhance user experience and gain valuable business insights.

Checkout Conversion
Data point: Conversion rate
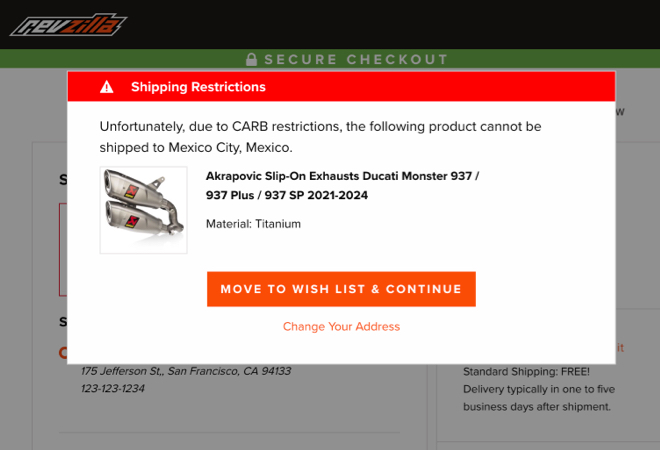
Product: RevZilla, Checkout workflow
Problem: 5% drop in conversion post relaunch
Method, Tool: Data collection, Google Analytics
Findings: Checkouts with restricted/limited items based on shipping laws had a 3% dropoff.
Strategy: Based on shipping address, prompt the user to either "shop alternatives" or "move to list" and enable them to complete checkout, when applicable. Progress is always saved, user rarely backs step when adjusting cart items.
Result: Baseline conversion in 1 month, Increased international conversions by 20% over 6 months.

Qualitative Organization & Analysis
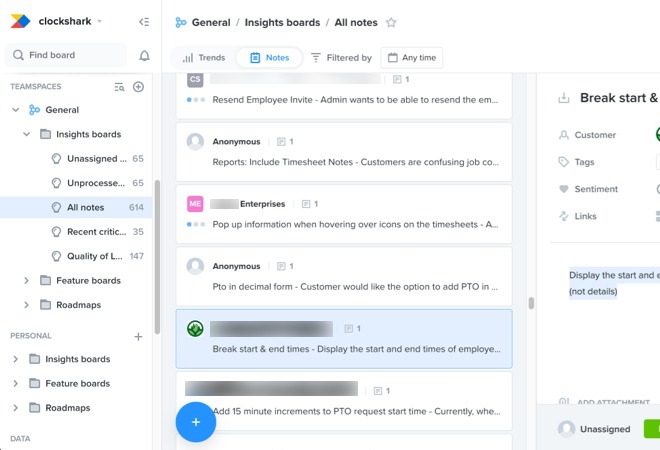
Data point: 1,000+ unorganized feedback items
Product: ClockShark, Productboard
Problem: Unusable collection of user feedback due to disorganization and lack of maintenance
Method, Tool: Grit and patience, Google > Airtable > Productboard
Known: Categorizing and evaluating feedback will provide product insights to inform the core product roadmap.
Strategy: Categorize, weight, and rank feedback in most advanced tools available in order to identify product opportunities.
Result: Identified 5 top roadmap intiatives for 2024/2025 (countless in the backlog), 100+ quality of life opportunities

QVC Styleguide
Data point: Online ad engagement
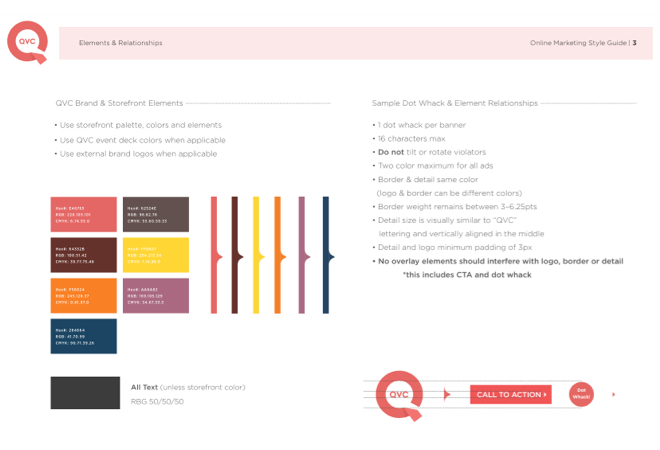
Product: QVC, Online marketing ads
Problem: Need to increase ad engagement, can't produce enough ads
Method, Tool: Output optimization, My strategic brain
Hypothesis: Decreasing the number of ad sizes would decrease design time, enabling higher quantity of output in a smaller variety of sizes. Purchasing more spaces in less sizes increases visibilty/spread while decreasing design time.
Strategy: Cut down from 7 ad sizes to 4, design with a styleguide
Result: 30% increase in design output, 2% increase in ad engagement

Usability Test Results
Data point: New user adoption
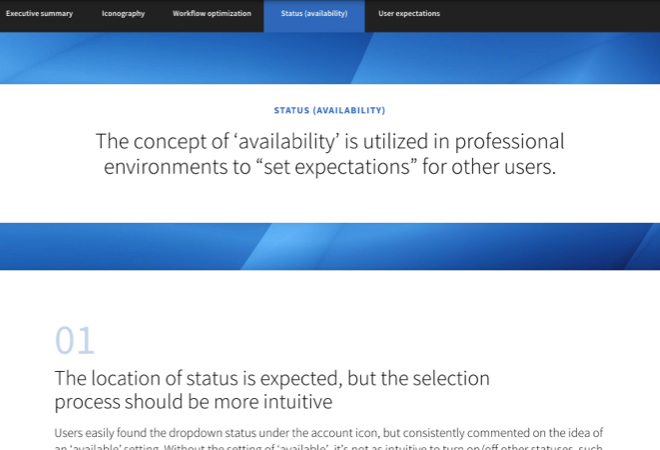
Product: Comcast, Business VoiceEdge (UCaaS)
Problem: Low new user adoption for new product line
Method, Tool: Moderated users tests, In-person
Findings: Low usability, unexpected user patterns and workflows
Strategy: Pair icons and text for clear communication and align status indicators with apps in the same vertical.
Result: Improved user sentiment, adoption increase of 2%